Custom dashboards (FREE)
Introduced in GitLab 12.1.
By default, all projects include a GitLab-defined Prometheus dashboard, which includes a few key metrics, but you can also define your own custom dashboards.
You may create a new dashboard from scratch or duplicate a GitLab-defined Prometheus dashboard.
Add a new dashboard to your project
UI option introduced in GitLab 13.3.
You can configure a custom dashboard by adding a new YAML file into your project's
.gitlab/dashboards/ directory. For the dashboard to display on your project's
Operations > Metrics page, the files must have a .yml
extension and be present in your project's default branch.
To create a new dashboard from the GitLab user interface:
- Sign in to GitLab as a user with Maintainer or Owner permissions.
- Navigate to your dashboard at Operations > Metrics.
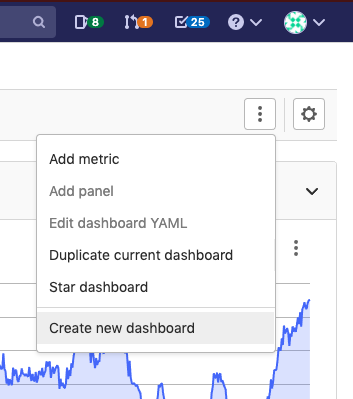
- In the top-right corner of your dashboard, click the {ellipsis_v} More actions menu,
and select Create new:

- In the modal window, click Open Repository, then follow the instructions for creating a new dashboard from the command line.
To create a new dashboard from the command line:
-
Create
.gitlab/dashboards/prom_alerts.ymlunder your repository's root directory. Each YAML file should define the layout of the dashboard and the Prometheus queries used to populate data. This example dashboard displays a single area chart:dashboard: 'Dashboard Title' panel_groups: - group: 'Group Title' panels: - type: area-chart title: 'Chart Title' y_label: 'Y-Axis' y_axis: format: number precision: 0 metrics: - id: my_metric_id query_range: 'http_requests_total' label: 'Instance: {{instance}}, method: {{method}}' unit: 'count' -
Save the file, commit, and push to your repository. The file must be present in your default branch.
-
Navigate to your project's Operations > Metrics and choose the custom dashboard from the dropdown.
Your custom dashboard is available at https://example.com/project/-/metrics/custom_dashboard_name.yml.
NOTE:
Configuration files nested under subdirectories of .gitlab/dashboards aren't
supported or available in the UI.
Add a new metrics panel to a dashboard
UI option introduced in GitLab 13.3.
The metrics dashboard supports various multiple panel types. You can quickly test how a panel configuration would display in your metrics dashboard with the Add Panel page:
-
Sign in to GitLab as a user with Maintainer or Owner permissions.
-
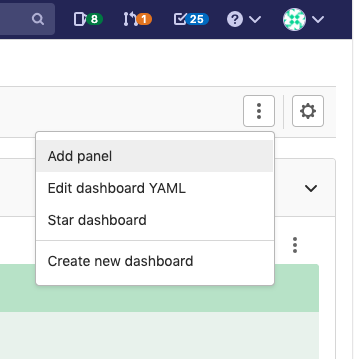
Click Add panel in the {ellipsis_v} More actions menu.
NOTE: You can only add panels to custom dashboards.
-
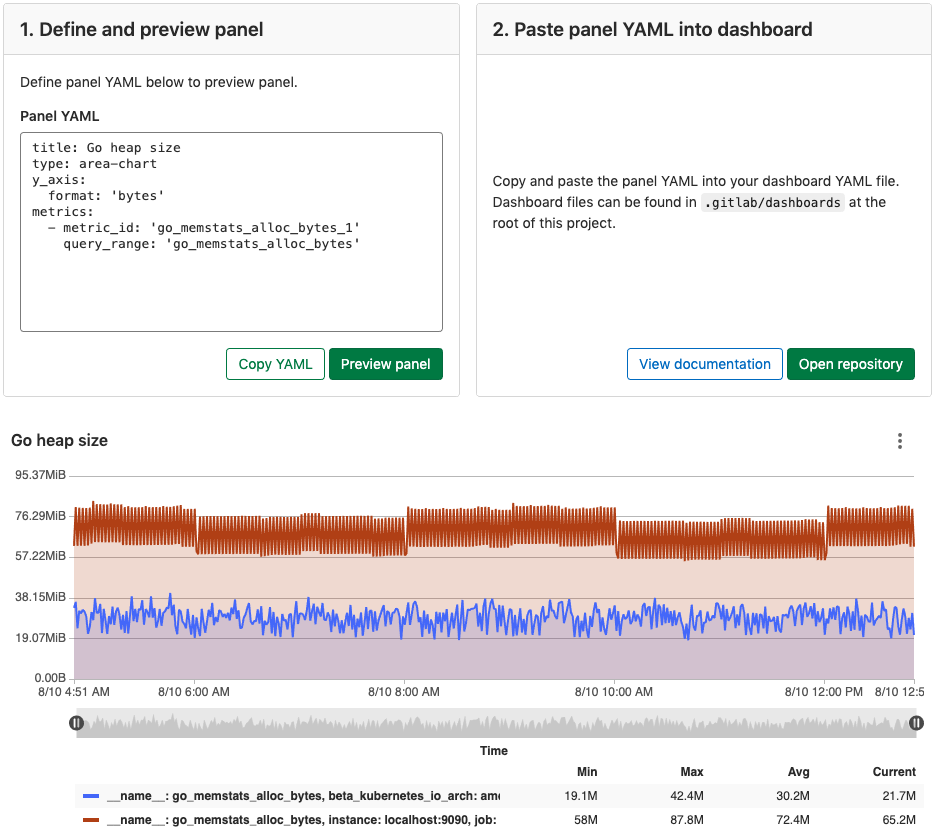
In the Define and preview panel section, paste in the YAML you want to preview in the Panel YAML field.
-
Click Preview panel, and GitLab displays a preview of the chart below the
Define and preview panelsection:
Duplicate a GitLab-defined dashboard
- Introduced in GitLab 12.7.
- GitLab versions 12.8 and later, custom metrics are also duplicated when you duplicate a dashboard.
You can save a complete copy of a GitLab-defined dashboard along with all custom metrics added to it.
The resulting .yml file can be customized and adapted to your project.
You can decide to save the dashboard .yml file in the project's default branch or in a
new branch. To duplicate a GitLab-defined dashboard:
- Click Duplicate current dashboard in the {ellipsis_v} More actions menu.
- Enter the filename and other information, such as the new commit's message, and click Duplicate.
- Select a branch to add your dashboard to:
- If you select your default branch, the new dashboard becomes immediately available.
- If you select another branch, this branch should be merged to your default branch first.
Your custom dashboard is available at https://example.com/project/-/metrics/custom_dashboard_name.yml.
Manage the metrics dashboard settings
Introduced in GitLab 13.2.
Users with project Maintainer or Administrator permissions can manage the settings for your metrics dashboard.
Chart Context Menu
You can take action related to a chart's data by clicking the {ellipsis_v} More actions dropdown box above the upper right corner of any chart on a dashboard:
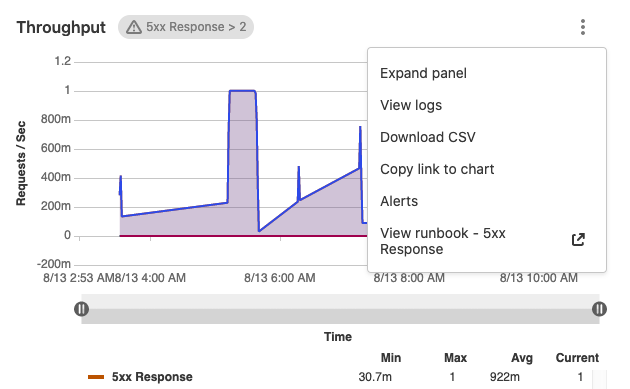
The options are:
- Expand panel - Displays a larger version of a visualization. To return to the dashboard, click the Back button in your browser, or press the Escape key. (Introduced in GitLab 13.0.)
- View logs (ULTIMATE) - Displays Logs, if they are enabled. If used in conjunction with the timeline zoom feature, logs narrow down to the selected time range. (Introduced in GitLab 12.8.)
- Download CSV - Data from Prometheus charts on the metrics dashboard can be downloaded as CSV.
- Copy link to chart
- Alerts - Display any alerts configured for this metric.
- View Runbook - Displays the runbook for an alert. For information about configuring runbooks, read Set up alerts for Prometheus metrics. (Introduced in GitLab 13.3.)
Timeline zoom and URL sharing
Introduced in GitLab 12.8.
You can use the Timeline zoom function at the bottom of a chart to zoom in on a date and time of your choice. When you click and drag the sliders to select a different beginning or end date of data to display, GitLab adds your selected start and end times to the URL, enabling you to share specific time frames more easily.
Dashboard Annotations
- Introduced in GitLab 12.10 (enabled by feature flag
metrics_dashboard_annotations).- Feature flag removed in GitLab 13.0.
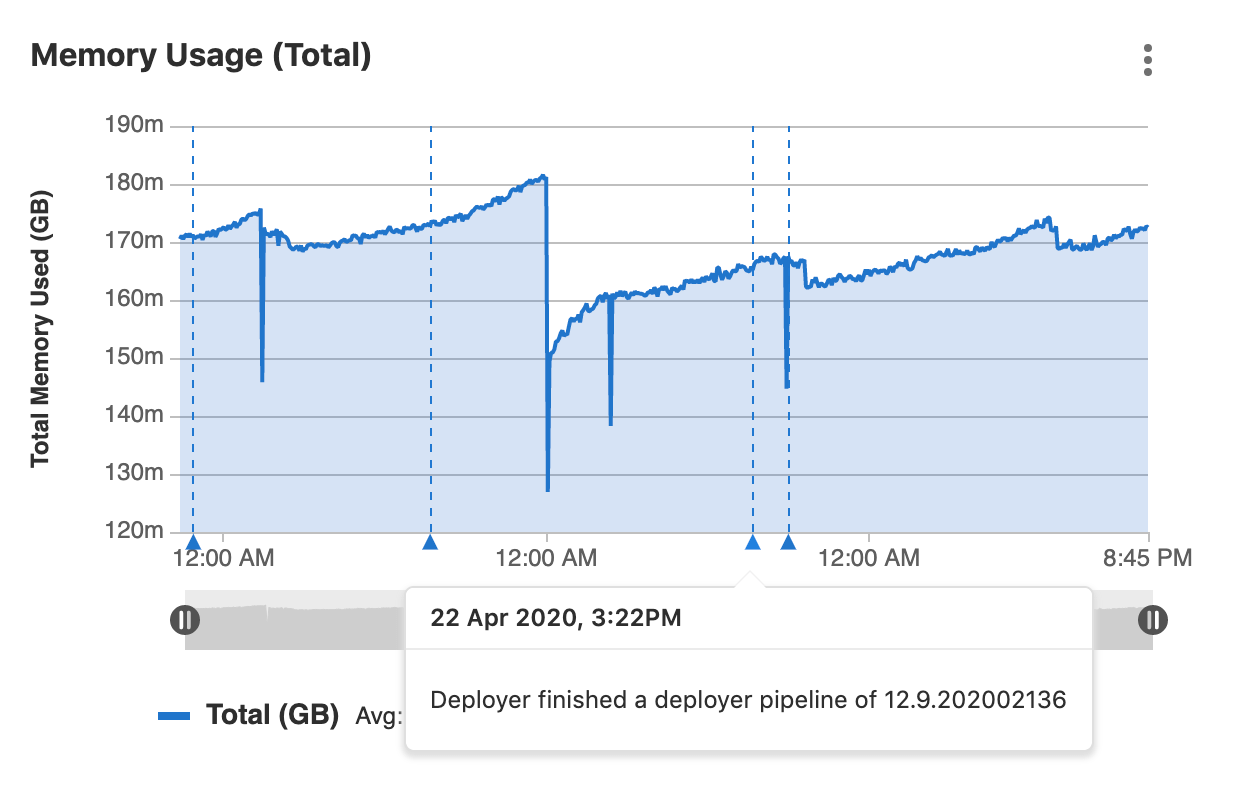
You can use Metrics Dashboard Annotations to mark any important events on every metrics dashboard by adding annotations to it. While viewing a dashboard, annotation entries assigned to the selected time range are automatically fetched and displayed on every chart within that dashboard. On mouse hover, each annotation presents additional details, including the exact time of an event and its description.
You can create annotations by making requests to the Metrics dashboard annotations API
Annotation retention policy
Introduced in GitLab 13.01.
To avoid excessive storage space consumption by stale annotations, records attached to time periods older than two weeks are removed daily. This recurring background job runs at 1:00 a.m. local server time.
Add related links to custom dashboards
Introduced in GitLab 13.1.
You can embed links to other dashboards or external services in your custom dashboard by adding Related links to your dashboard's YAML file. Related links open in the same tab as the dashboard. Related links can be displayed in the following locations on your dashboard:
- At the top of your dashboard as the top level
linksdashboard property. - In charts context menus as the
linksproperty of a panel.
Related links can contain the following attributes:
-
url: The full URL to the link. Required. -
title: A phrase describing the link. Optional. If this attribute is not set, the full URL is used for the link title. -
type: A string declaring the type of link. Optional. If set tografana, the dashboard's time range values are converted to Grafana's time range format and appended to theurl.
The dashboard's time range is appended to the url as URL parameters.
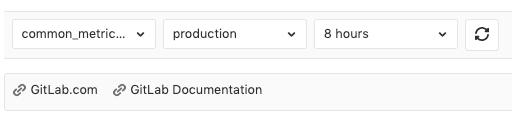
The following example shows two related links (GitLab.com and GitLab Documentation)
added to a dashboard:
Links Syntax
links:
  - title: GitLab.com
    url: https://gitlab.com
  - title: GitLab Documentation
    url: https://docs.gitlab.com
  - title: Public Grafana playground dashboard
    url: https://play.grafana.org/d/000000012/grafana-play-home?orgId=1
    type: grafana
Troubleshooting
When troubleshooting issues with a managed Prometheus app, it is often useful to view the Prometheus UI.
"No data found" error on Metrics dashboard page
If the "No data found" screen continues to appear, it could be due to:
- No successful deployments have occurred to this environment.
- Prometheus does not have performance data for this environment, or the metrics
are not labeled correctly. To test this, connect to the Prometheus server and
run a query, replacing
$CI_ENVIRONMENT_SLUGwith the name of your environment. - You may need to re-add the GitLab predefined common metrics. This can be done by running the import common metrics Rake task.